Grouping Documents with Topic Models
In this section, we examine how the software MALLET can be used to analyze and identify subtopics within our set of runaway ads. Through the use of this tool, we found that ads could be reliably sorted into specific categories, such as runaway ads and captured runaway notices, where they could be analyzed separately.
Rationale
Through our close readings of our runaway slave advertisement corpora, we quickly realized that a significant portion of the ads present were not ads posted by owners searching for runaways, but either ads posted by jailers who had captive runaways and were searching for the owners, or ads put up by citizens who had found and captured runaway slaves. While most of the language and intent in these ads was similar, there were enough differences to justify sorting them out from the other ads. From a geographic standpoint, these ads were the end-points of slaves’ runaway journeys, and can be plotted differently than runaway ads, which serve as a starting point of slaves’ journeys. From a data analysis perspective, the ads do not include categories of information like reward value or means of escape and would interfere with the collection of consistent data from ads on those categories. Finally, the capture notices also served as an independent source of information, since sorting them out would lead to new insights on how laws on slave capture and return were put into effect, or how they varied in terms of language from ads posted by slave owners.
While these ads can be individually identified and hand-sorted out of a corpus, both the number of runaway ads being dealt with and the number of capture notices make the process time prohibitive. However, differences in language and terminology between the types of ads made it possible to train a computer to differentiate between them based on these variables. Through the following sections, the methods behind this proces will be explained, and the resulting information examined.
Methodology
Our first step was to generate three topic models, one for each of the three states for which we had advertisements. To do this we downloaded and ran MALLET. Because our data were already stored in separate text files, one for each ad, we were able to train topics on our ads using MALLET’s command-line options and a tutorial on topic modeling at the Programming Historian.
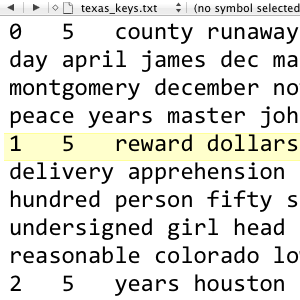
The methods followed were similar to those in the tutorial link above. The directory was imported from the folder of ads of the respective state. That directory was then imported into MALLET, which was run to export a text file containing 10 topics from the entire ad directory. The resulting text file for Arkansas is posted below.
[0  5   negro county arkansas man jail living stout miles mississippi st runaway territory august twenty francis union crittenden post justice
1   5   years complexion dark age color aged copper ranaway woman henry ar hempstead washington phillips height wife undersigned george men
2   5   black white negro coat hat pantaloons left shirt blue pair cotton pants cloth jeans brown coarse wool worn colored
3   5   state rock made river good delivered place countenance free secured tennessee face reasonable red purchased brought boat sold time
4   5   years negroes mulatto left large supposed clothing heavy built light hair sic girl bright marks make eyes lafayette men
5   5   sheriff committed pay belongs runaway property owner charges law forward prove day slave dealt jailor requested custody county pulaski
6   5   boy negro jail county scar john weighs feet sic pounds lbs inst jefferson thomas johnson side saline la weigh
7   5   reward named dollars subscriber give ran apprehension delivery person fifty paid twenty hundred plantation teeth stolen night expenses residence
8   5   high inches feet age years mr yellow william james inst black back miller head scars slender months lost jim
9   5   feet man black spoken inches small high fellow ten thirty speaks quick information nation tolerably set memphis sam securing ]
MALLET also outputs a spreadsheet showing the proportion of each document that is drawn from each of the topics; on each row, the filename of the document is followed by the number of the most prominent topic, followed by the proportion of the document associated with that topic. Other topics and proportions follow on the same row in decreasing order of weight.
In order to separate our ads, we first identified two topics in the keys file that seemed to be associated, respectively, with runaway ads and capture notices. For example, in the topic-keys listed above, topic 7 looks more like a runaway ad because of words like “reward,” “subscriber,” and “delivery,” while topic 5 looks more like a capture notice because of frequent terminology like “sheriff,” “committed,” “law,” and “jailor.”
Thus, we hypothesized that documents in which topic 7 was more prominent than topic 5 were more likely to be runaway ads, while documents in which topic 5 was more prominent than topic 7 were likely to be capture notices. A Python script, divide_docs.py, enabled us to test this assumption. The script analyzes the tab-delimited file output by MALLET and separates the files in each row into two directories, based on whether topic 5 or topic 7 appears first in that file’s row. We were then able to perform a close reading on some of the separated files to see whether we had accurately separated ads for captured slaves from those that had not been captured.
Conclusions
One concern with the use of topic modeling was the overall accuracy of the computer’s ability to discriminate between similar ads. Through analysis of the topic models for various states, it was found to have a high degree of reliability. Out of the 398 Texas Gazette ads, the topic model sorting method split the ads into 195 capture notices and 203 runaway ads. Manually searching the text of these sorted ads, we found there were 3 incorrectly identified ads in the capture notices and 1 in the runaway ads. In this set, there was a 99% accuracy for differentiating between ads. The Arkansas data set provided similar results. Out of 199 capture notices, 9 were found in error; out of 289 runaway ads, only 6 were in error. This gave the second data set an overall accuracy of 97%. With these percentages, it is possible to trust the results from the topic models to within a reasonable margin of error.
However, there are limitations to this approach. The first issue is the fact that there are always exceptions in the content of the material. One ad discovered in the Texas Gazette text was the report of a runaway slave found dead. This was identified by the topic model as strongly related to the runaway topic, even though the ad itself was a report of death. In the Arkansas ads, another ad was the report of a captured runaway who had escaped and run from the jailor. While this ad fell into both categories, the system used would only sort the ad into one set, thus leaving it out of the other data set.
Another limitation is the drop in accuracy as the number of topics allowed in the original program are increased. For the Arkansas ads, when searched with 15 topics rather than the original 10, the accuracy dropped significantly. In a set of 278 ads, 45 were incorrectly identified, dropping the accuracy to 84%.
From the sorted ads, there are a number of questions that can either be answered, or explored more fully. One issue we were running across during our close reading of the ads was the amount of variation between quantities of runaway ads and capture notices. Certain states had specific times where there was a much higher ratio of capture notices to runaway ads. Through use of another script designed to count the sorted ads by year, month, and decade, we established the following data, regarding the frequency of ad types over time. Blue represents all capture notices, and red represents all runaway ads.

Ads about Runaways in the Austin Gazette

Ads about Runaways in Arkansas Newspapers

Ads about Runaways in Mississippi Newspapers
From here, the change in the quantity of ads over time can be examined. Various historical events, in particular nationwide or state-specific laws, can be examined in conjuction with the changes of ads, to look for potential causation for these variations.
There is significant potential for additional exploration of the ad text through these tools. Even beyond these specific categories, further sorting of the ads through topic modelling is possible. Within the capture notices, there are different categories between jailer’s notices and citizen captures of slaves that could be differentiated. The runaway ads also include ads for slaves that were supposedly stolen, which are written in different enough language that they could be removed into a new subset of ads. In addition to increased sorting, the ads can also be examined with text mining. The text analysis tool Voyant could be applied to the narrowed sets of ads to look for specific trends in the language, through the methods explained here. Sorting the ads through MALLET is one step in many that can be taken to find and answer significant historical questions about the history of slavery.
