

Using Voyant for Text Analysis
This page walks through the process of using Voyant for digital text mining. Find here a link to our entire corpus of runaway ads uploaded into a Voyant skin.
Rationale
Digital text-mining tools can help researchers understand document collections that are prohibitively large for a close-reading. Our collection of runaway slave advertisements from Texas, Arkansas, and Mississippi totals over 2,500 individual ads! Not only would it be extremely time consuming to read this entire collection, the consistently short, boilerplate format of runaway ads can make it difficult to really distinguish between them. The ads from Texas, Arkansas, and Mississippi start to all look practically indistinguishable, making it difficult for close-reading alone to recognize pattern breaks between the states, without the assistance of computational data. This is where Voyant comes in. We hoped that the “distant-reading” capabilities of Voyant would be able to pick up on larger word usage trends that are not immediately apparent when reading with the human eye.
Additionally, as we read through our initial collection of Texas runaway ads, it became clear that these ads tell us little about the perspectives of runaway slaves themselves. Information about the slave is always filtered through the attitudes and beliefs of the slaveholder. Working within the limitations of this category of primary source, we became increasingly interested in analyzing the language of the slaveholders. In what sort of discourse on slavery were these subscribers engaged, and were there any differences across state lines? Across time? Voyant’s efficient “reading” skills and visualization capabilities make it easy to immediately spot differences between multiple corpuses or trends across one corpus. As students who have primarily worked with close-reading in the past, digital text-mining tools such as Voyant offer another angle of analysis into a text.
Methodology
Voyant is a free, online text-analysis program. Its tools allow you to generate a word cloud of most frequent words, generate graphs of word frequency across the corpus, and compare multiple documents. Once you have a text uploaded, you can play around within the Voyant “skin”, opening and closing different tools, or clicking on a particular word to see trends for that word specifically. It’s also possible to generate a link to the skin that can then be shared or embedded into a page, allowing others to explore the data on their own.
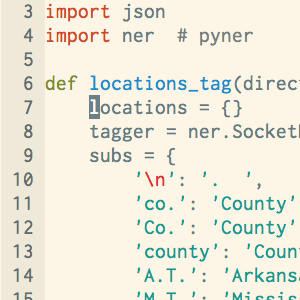
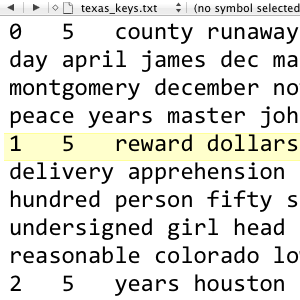
Once we had cleaned and prepared our collection of ads for analysis, using Voyant was very straightforward. The Voyant platform is compatible with a wide range of document formats, including plain text, HTML, XML, PDF, RTF, and MS Word. Once in the Voyant skin, it is easy to play around with tools simultaneously. Selecting a word in the “Summary” tool, for example, will automatically pull it up in the “Word Trends” tool. The “Words in the Entire Corpus” tool allows you to easily search and store keywords into a collection of favorites. Selecting multiple words in “Words in the Entire Corpus” allows you to analyze them side-by-side.

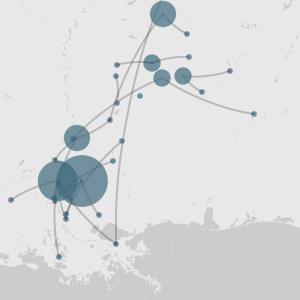
All state ads uploaded into the Voyant skin
There are certain decisions that have to be made before even uploading your documents into Voyant. Throughout the digital reading process, one of our primary questions has been how to split the corpus of ads. For example, uploading a single document of all ads from a single state is useful for looking at language data in aggregate for a single state. This screenshot shows the word “negro” selected from all the Texas ads uploaded as one document.

All Texas ads uploaded into the Voyant skin
Because we were careful to keep our ads in chronological order, the Word Trends tool shows trends over time. However, you could also make the choice to manually split a corpus into separate documents by time increments to more easily track specific changes across the corpus. Or, as an example of how Voyant could be applied to a different kind of primary source, a single book could be split into separate chapters. This screenshot also shows the word “negro” selected, this time with the Texas ads split by decade.

All Texas ads split by decade
At a glance, it is easy to see that the Word Trends graph looks very different depending on whether the corpus is segmented into 10 even parts by Voyant, or split into 10-year increments. There’s not one right way to split a corpus, it just depends on what kind of analysis you want to focus on. It is good to keep in mind though, that these decisions could alter the appearance of the data.
Finally, certain corpus categories can be split by geographical location. This method of dividing a corpus is useful for comparing language trends across geographical lines. This screenshot shows the Texas corpus of ads split by the Houston area (The Telegraph and Texas Register, 1836 to 1860) and the Austin area (Texas Gazette, 1850 to 1860), and reveals that the word “negro” appears relatively more frequently in the Austin area.

All Texas ads split by geographical location
One advantage of Voyant is that it analyzes relative frequencies, not just raw word counts, in order to adjust for imbalances in document length. A few useful tips for using Voyant: To apply stop words, click on the wrench icon in the upper right-hand corner to choose a pre-made list, or add your own. Stop words are common “filler” words such as articles, prepositions, pronouns, and conjunctions. Filtering out stop words before analyzing a text will remove frequent but uninteresting words such as “the”. To save a url to the current Voyant skin, create an HTML link to embed, or download an image, click on the floppy icon.
Find here a list of all Voyant tools, including some which are not pre-loaded into the basic Voyant skin. For a tutorial on how to compare one Voyant skin corpus to a separate Voyant skin corpus, visit this post from Brian Croxall.
Conclusions
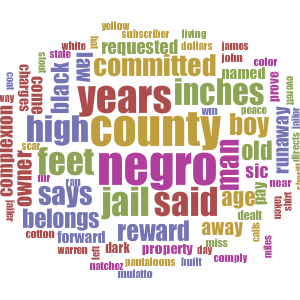
Our primary findings in Voyant focused heavily on the use of racial and ethnic descriptors in the ads. In most runaway ads, the subscriber tends to give some description of the runaway’s complexion or racial status. We were interested in tracking variations in these terms across states.
The embedded graph below shows trends for the word “African” across the entire collection of Texas ads from 1836 to 1860. Over time, the frequency of this word goes down until eventually reaching zero. As a class, we speculated about potentially finding evidence of the Atlantic slave trade continuing in the early years of Texas. These trends would suggest that to be the case. Although the United States criminalized international slave trade in 1807, as an independent nation from 1836 to 1846, Texas was not subject to these restrictions. The heaviest use of the word “African” occurs in years 1836 (the first year we have data for) to 1838, and then sporadically after that. The latest mention of an African runaway in Texas occurs in 1857, for a slave 38 years old. Presumably, the growing international abolition movement and the eventual annexation of Texas to the United States contributed to the gradual disappearance of notices for runaway Africans.
Raw frequency of “African” across all Texas ads
As a note, one of the benefits of Voyant is that it allows users to copy an html link to embed Voyant tools into their own blog. Rather than a static screenshot, readers can change the settings on the embedded tool. Try playing around with the settings on this embedded Word Trends tool and all following graphs.
The word “African” appears most frequently in Texas compared to the other states, and slightly more frequently in Mississippi than in Arkansas. This confirms our suspicions from close-reading that Texas had higher numbers of Africans than the other states. We also speculated that Mississippi and Texas, with access to ocean ports, had higher numbers of African slaves than landlocked Arkansas due to easier shipping trade routes.
Relative frequency of “African” across all three states
Our explorations of the word “African” in Voyant exemplify the ways that digital text mining tools can not only help confirm hypotheses from close-reading but also raise previously unthought of questions for further close-reading. Chronological and georgaphical trends for the word “African” encouraged us to research the history of international slave trade and abolitionism, and think about how these relate to Texas’s history and its position as an independent nation. For more information about the presence and influence of African slaves in nineteenth-century Texas, see Sean Kelley’s essay Blackbirders and Bozales: African-Born Slaves on the Lower Brazos River of Texas in the Nineteenth Century. Kelley attributes the relatively high number of African slaves in Texas to the Western expansion of plantations into Texas to meet increased demand for slave-produced products, and to the legally-chaotic borderland status of Texas.
We also used Voyant to track variations in language descriptors by state. We found that the French word “Griff(e)” occurs much more frequently in Texas, followed by Mississippi, and not at all in Arkansas. (Just as a side note, this sometimes occurring “e” highlights the importance of checking for variations or abnormalities in spelling when conducting digital research.) Tracking the word “Griff(e)” alongside “Mulatto” reveals that while Texas and Mississippi have higher use of the word “Griff(e)”, Arkansas has higher use of the word “Mulatto.”
Additionally, Texas and Mississippi – the states where the French word “Griff” is used – also have higher occurrences of the word “French” suggesting a more significant presence of French people or the French language in these states. In Arkansas subscribers were more likely to prefer the term “Mulatto” to refer to someone of part white, part black ancestry, whereas in Texas and Mississippi they used both “Mulatto” and “Griff(e)”.
Variations in racial descriptors across all three states
Overall, Voyant has been a very useful tool for our historical project on Texas runaway ads. The majority of Voyant’s limitations are due to the fact that the software is still in beta mode. The platform can be a bit jerky, slow to load, or sometimes gets stuck loading. Scrolling through the tools is not always a smooth, straightforward process. Unfortunately, while the favorites feature is useful, this list can’t be saved for future use when generating a skin URL. Despite these hiccups, we recommend the tool for historians hoping to take a “distant reading” of their documents.